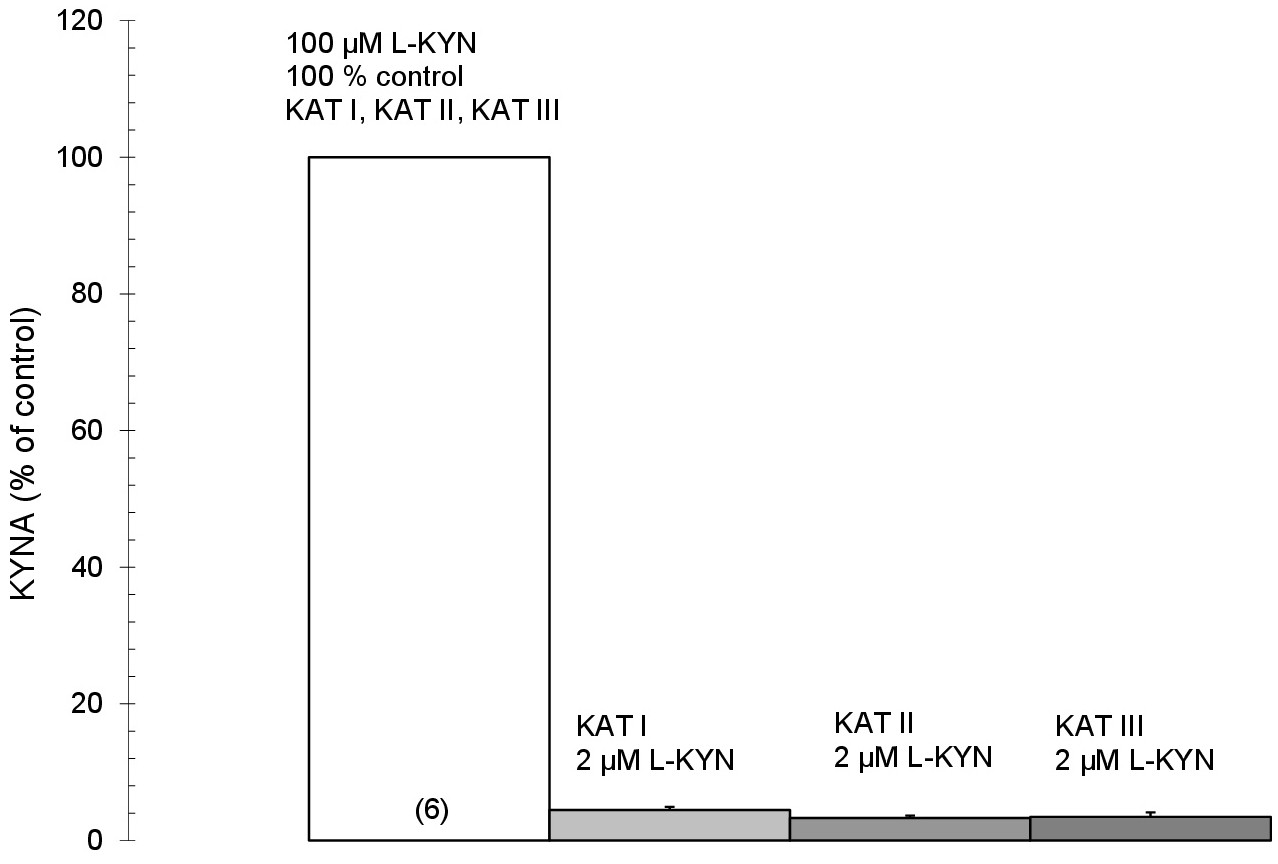
Fig. 2. Comparison of KYNA synthesis in human saliva using 2 µM and 100 µM L-kynurenine (L-KYN) in the incubation mixture under standard assay conditions for KAT I, KAT II and KAT III. Data represent the mean ± SEM. KAT I, II and III activity is expressed as % of control. KAT activity in the presence of 100 µM L-KYN in the incubation medium is expressed as 100%. Six saliva samples were used.